- Today
The JERK Report #38: Unemployment is the signal; the jobs number is the noise around it
Every first Friday a jobs number lands, and the first question is whether it is good or bad. Start one step earlier. How many jobs does the country need? And also our benchmarks are moving, and that reminded me of the Dewey Beach buoy moved by a nor’easter in Sept 2026.
I met with a fractional CFO this morning who told me before our call that he eagerly awaits the jobs numbers from BLS the first Friday of the month and listens to Bloomberg radio a lot.
That made me smile and realize why we were introduced and so I did a niche report on the job numbers coming this Friday.
Yes, I’d covered job numbers in my very first JERK report, but I’m diving deeper to help you think about the trends upstream of the trends. Immigration is a big part of it.
The JERK layers
Let’s show the big picture Jerk layers, then we will dive into what this means and how you apply it in your business.
Table 1
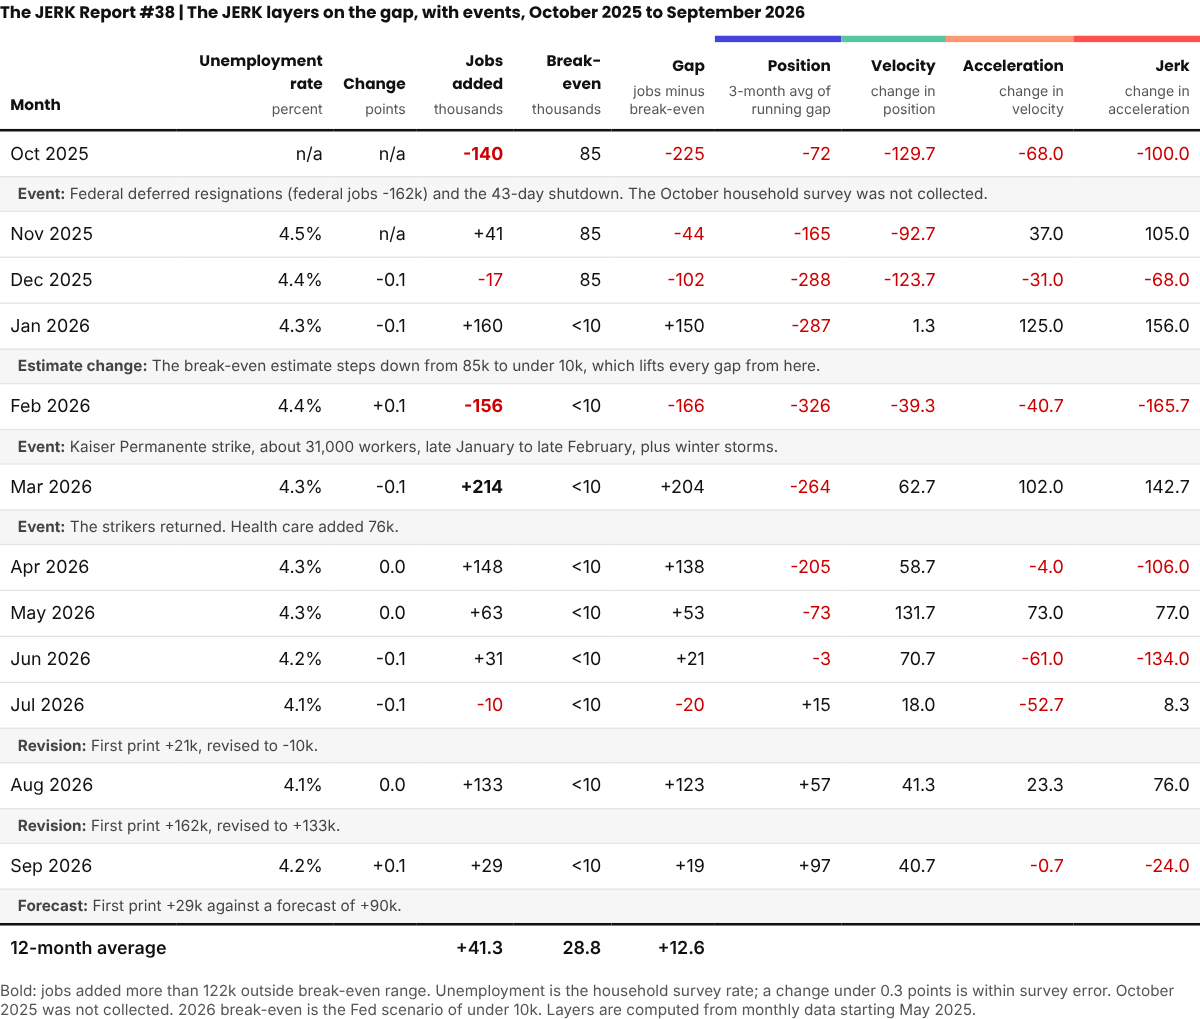
All figures are thousands of jobs, worked out from published monthly numbers. Jobs are the current values (FRED, October 2, 2026 vintage), Gap is jobs added minus break-even. We are doing a 3 month average to reduce some of the noise also.
Position
The Position is +97k: the running total of gaps, averaged over three months. It has risen every month since February.
Velocity
The Velocity is +41k a month, the change in position, and it is generally upward. It peaked near +132k in May and has eased since.
Acceleration
The Acceleration this month is -0.7k, the change in velocity, so the gains stopped speeding up. Acceleration has been oscillating all year.
Jerk
And Jerk is -24k, the change in acceleration. Jerk is also oscillating most months.
Oscillation is what noise looks like.
What the data shows
Right now, the number to watch is unemployment. The jobs number only means something against break-even, the jobs needed to hold unemployment steady.
1. Jobs are needed for new workers to hold unemployment numbers steady.
Add 100 workers and it takes 100 new jobs to hold unemployment steady. This is called break-even or break-even number of jobs. The difference between break-even and actual I am calling the gap.
2. Break-even fell because fewer workers are arriving by immigration.
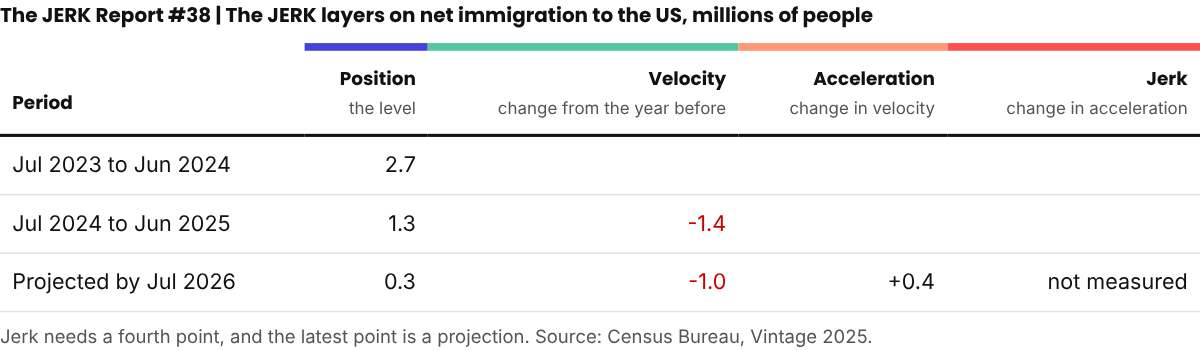
Census net immigration was 2.7M (July 2023 to June 2024), 1.3M (July 2024 to June 2025) and a projected 0.3M by July 2026.
Table 2
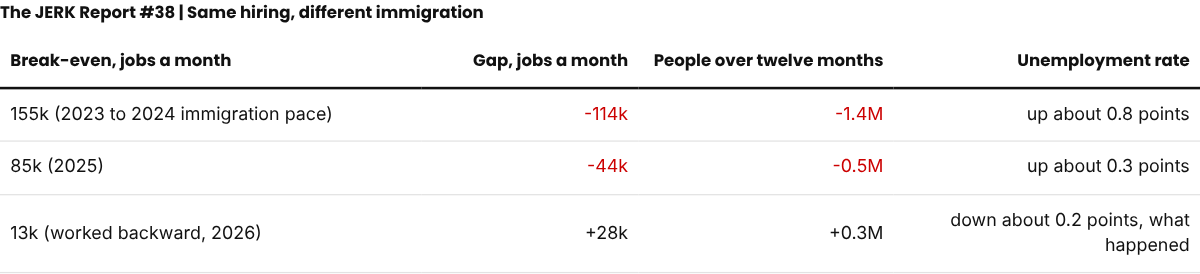
Fed staff put break-even at about 155k jobs a month in 2023 and 2024, and about 85k in 2025.
For 2026 they say it could fall under 10k. That scenario assumes less immigration than Census projects.
That is the why. Three yearly points on immigration are too few to measure jerk, so we have to look at the gap between jobs added and break-even numbers.
3. One month tells you little. You need the wider trends.
The BLS says a single month's jobs change can be off by about 122k either way (90% confidence). A month within 122k of break-even cannot be distinguished from break-even. Only three months fell more than 122k outside a break-even range of 0 to 50k, and each had an event:
• October 2025 (-140k revised, -105k initially): 162k federal jobs lost to deferred resignations, and the 43-day shutdown.
• February 2026 (-156k revised, -92k initially ): a strike by about 31,000 Kaiser Permanente workers, plus winter storms.
• March 2026 (+214k): the strikers returned.
4. Unemployment rises only when hiring falls below break-even.
A flat break-even does not push unemployment up. Hiring of 41k a month sits above break-even of about 13k a month, so unemployment should hold or edge down (derived). It would rise if hiring dropped below break-even for a few months, or if break-even climbed back as immigration recovered.
5. 41k new jobs a month is enough for the current number of workers.
Jobs averaged 41.3k a month and unemployment fell from 4.4% to 4.2% over 12 months. Working backward, break-even was near 13k jobs a month, plus or minus 43k. Why allow 43k a month of error, a range larger than the number itself? The unemployment rate is rounded and sampled (additional details are described in the attached). That puts break-even anywhere from -30k to +56k a month.
6. The same hiring at the 2023 immigration pace would look far worse.
Break-even would be near 155k a month, and 41.3k a month of hiring would fall short. Unemployment would rise about 0.8 points over twelve months, nearly three times the 0.3-point one-month survey threshold, so well outside the noise.
Table 3
What seems to be happening, from first principles
1. The unemployment rate holds steady when jobs grow as fast as the number of people looking for work.
2. New people looking for work come mostly from school and from abroad. They leave by retiring.
3. Arrivals from abroad fell sharply, and aging adds a slow drag. So fewer jobs are needed each month.
4. Young people are the other source of arrivals, and they are harder hit than older workers when hiring slows. Unemployment at ages 16 to 19 was 14.5% in September against 13.3% a year earlier (BLS Table A-1, noisy). For college graduates aged 22 to 27 it was 5.3% in March 2026 (12-month average) against 4.3% overall (EPI).
5. Hiring slowed with the need for jobs: 41.3k a month over the year, 50.7k over the last three months. Unemployment did not rise.
6. Slow hiring has two possible causes: fewer people to hire, or fewer jobs offered. The jobs number cannot tell them apart. Unemployment can. Steady or falling points to the first cause. Rising points to the second. So far unemployment has been steady, with fewer immigrants.
7. Revisions can change the picture. July and August were revised down by 31k and 29k, and the preliminary benchmark was -79k. Check each new release for revisions to earlier months.
8. So a small jobs number can mean fewer workers, not a weaker economy. The risk to watch is unemployment rising, not hiring that is merely slow.
9. What is not known: how far immigration has really fallen (2026 is a projection), and why unemployment fell more than jobs alone imply.
What it means for the country
The Fed staff note of April 2, 2026 and its footnotes are like the footnotes of an annual report, where you go to look for the anomalies and more subtle clues. This table compares the Fed staff note with what this data suggests, and shows where they align or differ.
Table 4
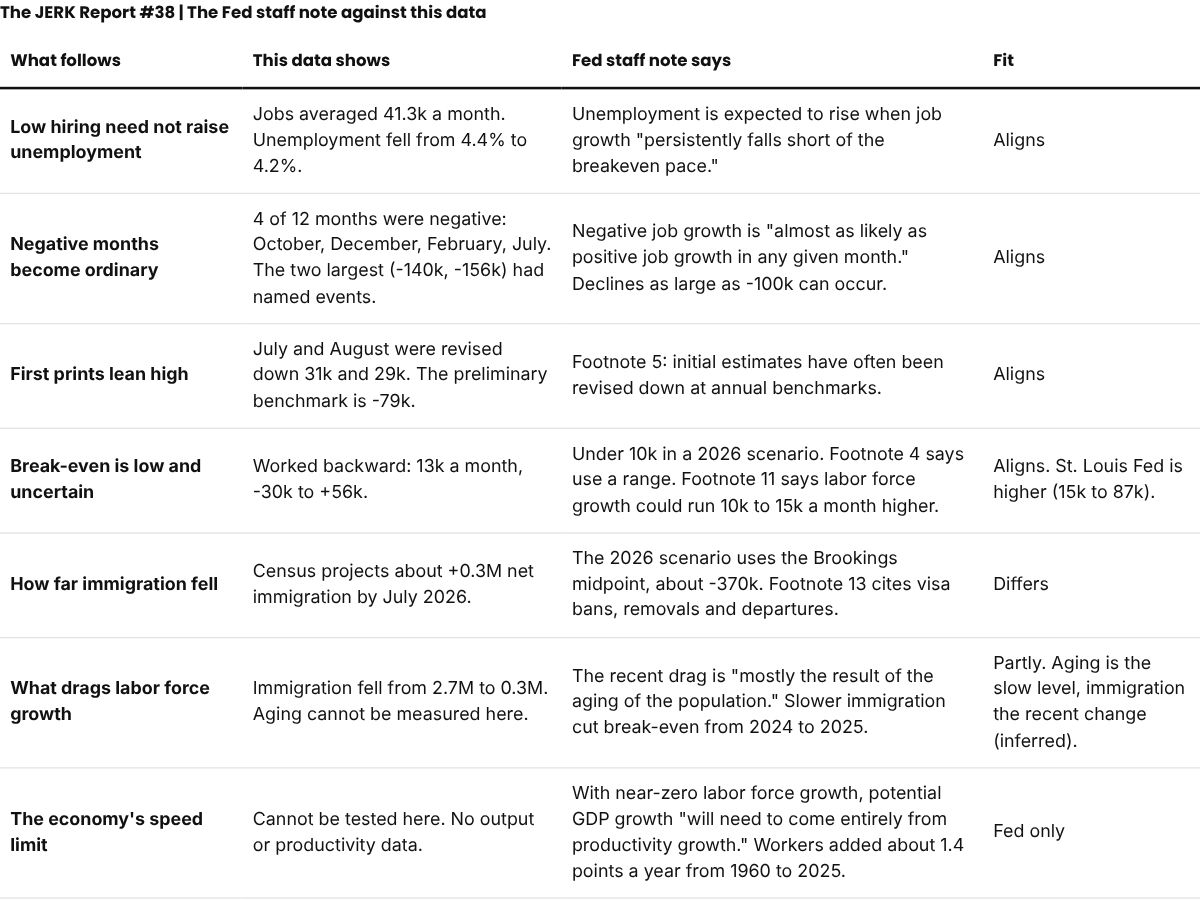
Risk runs both ways; if immigration recovers, the break-even rises and the same hiring stops being enough.
What to do
Read unemployment before the jobs number, know right now a move under 0.3 points is within survey error.
Act on a trend. Unemployment rising for two or three months, or a three-month average of jobs below break-even, is a signal to watch.
Apply this concept to your own business metrics.
5 Minute Practice to apply these ideas in your business
Every business has a break-even. It is the new work you must start each month to keep your people busy. This is analogous to the jobs report with a count, a need and a gap.
Today’s prompt for your LLM:
Help me find my business break-even in five minutes, using the JERK method. Plain words. Ask me one question at a time. Never invent a number. If I do not know a number, say so and help me work out how to get it.
ASK ME FOR
1. What counts as new work in my business: projects, deals, customers or orders.
2. My monthly break-even: the new work I must start each month to keep my team's work steady, and how I worked it out.
3. The new work I started in each of the last six months.
THEN DO THESE IN ORDER
1. For each month, subtract my break-even from the new work I started. That is the gap.
2. Add the gaps up for a running total.
3. Average the last three gaps and the three before. Say whether the average is rising or falling, and by how much.
4. Show a small table: month, started, break-even, gap, running total.
5. In two sentences, say whether I should hold, watch more closely or act now, and what would change your answer. If the average gap has fallen for three months, say that revenue is likely to follow.
6. Ask what comes earlier than my new work, such as proposals sent or days to close a deal. If I have those numbers, run the same steps on them.
7. Optional, only if it fits my business: give me one line to add to my monthly meeting agenda, new work started against break-even.
Add a reminder that this is a reading of trends, not financial advice.
If you are curious to apply JERK to national jobs numbers, there is a prompt in the PS, along with more detail about this data.
I would love for you to start using this JERK lens in your business, and please email me what you find, or book a call if you have questions as you go.
Best wishes,
Rose
Sources
1. Measured: BLS Employment Situation, September 2026 release (jobs, unemployment, participation, ages 16 to 19 in Table A-1, signs of giving up, 122k margin, revisions).
2. Measured: BLS Employment Situation, earlier releases for the months in Table 1: February data, March data, June data.
3. Measured: FRED, All Employees, Total Nonfarm (PAYEMS) (monthly jobs levels, vintage October 2, 2026).
4. Measured: Method changes: shutdown and the household survey; January 2026 population controls; birth-death model; preliminary benchmark.
5. Measured: EPI, Class of 2026 (ages 22 to 27, Current Population Survey, 12-month averages).
6. Projected: Census Bureau, Vintage 2025 population estimates (net immigration).
7. Estimate: Fed staff note, April 2, 2026 (break-even 155k, 85k, under 10k; the quoted line).
8. Estimate: Brookings, January 13, 2026 (break-even -20k to +50k for 2026).
9. Estimate: St. Louis Fed, March 24, 2026 (break-even 15k to 87k for 2026).
10. Reported: AP via WTOP (Kaiser strike); NBC News (deferred resignations, shutdown, October first print); ING (winter storms, February first print); Scripps News (the birth-death model change); FactSet (the 90k forecast, median of 27 estimates).
11. Reported: NBC Philadelphia (three Coast Guard buoys from Cape May washed up at Dewey Beach, September 24, 2026).
12. Derived: break-even near 13k and its range of -30k to +56k, and the 41.3k twelve-month average. These are my arithmetic from rounded published numbers.
13. Cover image: generated on Google AI Mode Nano Banana inspired by recent Dewey Beach, DE buoy beached by a nor’easter Sept 2026.
PS. The very long Additional Notes
Below is detailed context that may or may not be of interest: where the break-even range comes from, how it is calculated, what changed in the data, and what the data does not show, and a prompt to analyze the BLS jobs numbers.
Your prompt for weekly jobs data
Paste this into your LLM (Claude, ChatGPT, Gemini or similar) each time a jobs number comes out. If your LLM can browse the web, it fetches the data itself. If it cannot, attach a screenshot of the release.
Read this week's US jobs data with me from first principles. Plain words. No em dashes. Label each statement measured, derived or inferred. Never estimate a number you could not find. If a number is missing, say so and ask me.
GET THIS WEEK'S DATA YOURSELF
- Monthly jobs report: the BLS Employment Situation release at https://www.bls.gov/news.release/empsit.htm and take the change in total nonfarm jobs for the latest month, the revisions to the two prior months, the unemployment rate, the participation rate, the unemployment rate for ages 16 to 19 (Table A-1), and the signs of people giving up: discouraged workers, people working part time for economic reasons, and people not in the labor force who want a job.
- Weekly jobless claims: the U.S. Department of Labor Unemployment Insurance Weekly Claims news release at dol.gov. Take this week's initial claims and the four-week average, if a new report is out.
- Events: any strike, shutdown, weather event or federal job cut that the BLS release or a major news outlet names for the month.
- Yardstick changes: open every source on the reference card below and say whether it has changed since November 2, 2026.
If you cannot browse the web, say so and ask me to attach a screenshot of the release or type the numbers.
REFERENCE CARD (last updated November 2, 2026). Each line stands on its own.
- Margin of error on one month's jobs change: about 122k either way, at 90% confidence. Source: BLS Employment Situation, September 2026 release, https://www.bls.gov/news.release/archives/empsit_10022026.htm
- Margin of error on a one-month change in the unemployment rate: about 0.3 points. A smaller move is within survey error. Source: same BLS release.
- Break-even means the jobs added each month that hold the unemployment rate steady. The estimates below differ mainly in the net immigration they assume.
- Break-even, Fed staff (April 2, 2026): about 85k a month in 2025, and under 10k a month in 2026 in a scenario with net immigration near -370k for the year. Source: https://federalreserve.gov/econres/notes/feds-notes/labor-force-growth-breakeven-employment-and-potential-gdp-growth-20260402.html
- Break-even, Brookings (Edelberg, Veuger, Watson, January 13, 2026): -20k to +50k a month for 2026, across a low-immigration scenario (-20k to +20k) and a high-immigration scenario (+10k to +50k). Source: https://www.brookings.edu/articles/macroeconomic-implications-of-immigration-flows-in-2025-and-2026-january-2026-update
- Break-even, St. Louis Fed (Bick, March 24, 2026): 15k to 87k a month for 2026. The low end assumes net immigration of -77k a month. The high end assumes +48k a month (CBO, January 2026). Source: https://www.stlouisfed.org/on-the-economy/2026/mar/breakeven-employment-growth-estimate-range-widens-2026
- My working break-even range: 0 to 50k a month. It overlaps all three estimates except the top of the St. Louis Fed range. Change it only if I say so.
- Net immigration, Census Bureau (Vintage 2025): 2.7M for July 2023 to June 2024, 1.3M for July 2024 to June 2025, and about 0.3M projected by July 2026. Source: https://www.census.gov/newsroom/press-releases/2026/population-growth-slows.html
- Latest three-month average of the monthly jobs change: 50.7k a month, July to September 2026. Source: BLS September 2026 release, with job levels from https://fred.stlouisfed.org/series/PAYEMS
- Latest unemployment rate: 4.2% in September 2026. Source: BLS release above.
- Labor force participation rate: 61.8% in September 2026 against 62.5% in September 2025. About 0.4 points of the fall is the January 2026 population reset. Source: BLS release above.
- Signs of people giving up, September 2026 against September 2025: discouraged workers 414k against 555k, people working part time for economic reasons 4.5M against 4.6M, people not in the labor force who want a job 5.8M against 5.9M. Source: BLS release above.
- Unemployment rate for ages 16 to 19: 14.5% in September 2026, against 13.3% in September 2025. It is noisy from month to month. Source: BLS release above, Table A-1.
- Method change: the October 2025 household survey was never collected because of the shutdown. Source: https://www.bls.gov/cps/methods/2025-federal-government-shutdown-impact-cps.htm
- Method change: January 2026 population controls cut the labor force by 1.4M and participation by 0.4 points, left the unemployment rate unchanged, and did not revise earlier months. Source: https://www.bls.gov/cps/methods/population-controls/experimental-series-accounting-for-january-2026-population-control-effects.htm
- Method change: in January 2026 BLS changed the birth-death model it uses to estimate jobs at new and closing businesses. Source: https://www.bls.gov/sae/notices/2025/upcoming-changes-to-the-establishment-survey-birth-death-model.htm
- Benchmark revision: the preliminary revision to the jobs count is -79k, and it becomes final in February 2027. Source: https://www.bls.gov/news.release/archives/prebmk_08282026.htm
DO THESE IN ORDER
1. Fetch this week's data from the sources above. Read each number back to me with its label, the page date and the URL. Write "not found" for anything you could not get. Never fill a gap yourself.
2. Check each yardstick source on the reference card. List what changed since November 2, 2026 and which numbers on the card it makes out of date. If nothing changed, say so. Do not use a replacement number until I confirm it.
3. Subtract each break-even estimate from the jobs print. The difference is the gap.
4. Say whether the print is more than 122k outside my working range. If not, say it cannot be told apart from break-even.
5. Recompute the three-month average with the revised prior months. Say whether it rose or fell, and by how much.
6. Compare the unemployment rate with the last one. A move under 0.3 points is within survey error. Say whether it has moved the same way for two or three months. Say whether ages 16 to 19 moved with the total or apart from it, and note that it is noisy. Say whether participation fell while unemployment fell. If it did, say that people giving up may explain part of the fall, and check the signs of giving up.
7. If you found claims, compare the four-week average with the previous four weeks. Do not apply the jobs margin to claims.
8. In one sentence, say whether the data shows signal, noise or a named event.
9. Say which applies, in two sentences: hold my assumptions, watch more closely, or revisit my break-even range. Say what would change your answer.
10. Give me an updated reference card to paste next time: new three-month average, unemployment rate, participation rate, signs of giving up, ages 16 to 19, and every yardstick or assumption that changed.
This is an analysis of one data release, not investment advice. If I ask for a trade or allocation decision, say it is outside this analysis and name who decides.
Where the break-even range comes from
Each source below estimates the same thing: break-even, the jobs added each month that hold unemployment steady. They differ mainly in how much net immigration they assume.
• Fed staff, April 2, 2026: break-even was about 85k a month in 2025. In 2026 it could fall under 10k a month, in a scenario with net immigration near -370k for the year.
• Brookings, January 13, 2026: break-even of -20k to +50k a month for 2026, across a low-immigration scenario (-20k to +20k) and a high-immigration scenario (+10k to +50k).
• St. Louis Fed, March 24, 2026: break-even of 15k to 87k a month for 2026. The low end assumes net immigration of -77k a month. The high end assumes +48k a month, from the CBO.
• This report, worked backward from unemployment: about 13k a month, between -30k and +56k.
The range 0 to 50k overlaps all but the top of the St. Louis Fed range. It is the default in the prompt above.
Break-even, worked backward from unemployment
The idea: if unemployment fell, jobs grew by more than break-even. Measure how much more, and subtract it from the jobs actually added.
Table 5
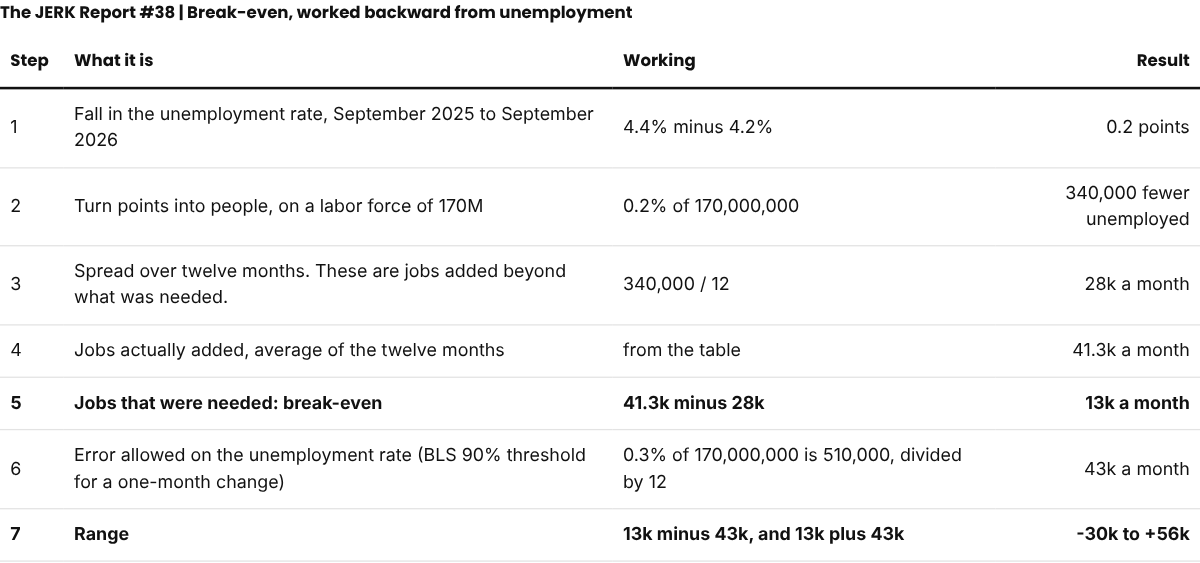
The 28k in step 3 and the 43k in step 6 are two different things. One is how far unemployment fell, 0.2 points. The other is how far off the rate could be, 0.3 points. I took the 0.3 from the BLS 90-percent threshold for a significant one-month change in the rate. Using it on a twelve-month change is my assumption. This is a rough check, not a measurement. It treats the whole fall as coming from jobs beating break-even, and it mixes the jobs count with the household survey.
Why allow 43k a month of error. The unemployment rate is reported to one decimal and comes from a survey, so it carries error. This report allows 0.3 points. On a labor force of about 170M, 0.3 points is 510k people, or 43k a month over twelve months. That is added to and subtracted from the 13k estimate to give -30k to +56k. The 0.3 is the BLS 90-percent threshold for a significant one-month change in the rate. Using it on a twelve-month change is an assumption. The steps are in the table above.
Three things that changed how the numbers are collected
• The shutdown cancelled the October household survey. In November only 64.0% of households answered, against 68.4% on average.
• In January 2026 the government reset its population estimates. The labor force dropped by 1.4M and participation by 0.4 points. The unemployment rate did not change. Earlier months were not revised, so the jump is not real job loss.
• In January the method for estimating jobs at new and closing businesses changed. BLS has not published how much it moved the level.
Unemployment and Labor Force Participation Related data
• Unemployment counts only people looking for work. Someone who gives up leaves the count, so unemployment and the break-even number fall without a job being added. Someone who takes a lower paying or part-time job counts as employed, which also skews the unemployment numbers. So read participation beside unemployment.
• Participation fell, but not because people quit. Workforce participation was 61.8% in September against 62.5% a year earlier. That was not a change in behavior. It was a change in how it is measured: about 0.4 points of that drop is the January reset of the population estimates (BLS). The usual signs of giving up did not rise: discouraged workers were 414k this year against 555k last year, and people working part time for economic reasons were 4.5M against 4.6M. That suggests the lower break-even comes from fewer new arrivals rather than people quitting the search.
What this does not show
• 2026 immigration is a Census projection, not a direct measurement.
• Layoffs are not measured here. Weekly initial jobless claims are the closest weekly view, and the prompt above fetches them.
• The 13k break-even estimate is my arithmetic from rounded numbers.
• Against the Fed's lower break-even, the January, April and August jobs numbers would also stand out from it. I found no sourced cause for January or August.
• The preliminary BLS benchmark revision to jobs, -79k, becomes final in February 2027.
Rose Thun founded Design Rosetta, a Baltimore firm that helps leaders think clearly about new technology and trains their teams to use it. She’s built products and led teams through five waves: aerospace composites, early internet, mobile, additive manufacturing, and AI. She’s watched adoptions succeed and fail. The difference is rarely the tech. Rose works with leaders who want to understand the tools themselves, and want their team to understand them too, so the organization doesn’t rest on one person knowing everything. Her clients decide faster and get their time back. She teaches AI fluency, Answer Engine Optimization, and signal reading with the JERK framework. She publishes The JERK Report every Monday. Short read on catching change early enough to do something about it.
Last reviewed November 2, 2026.
Check out the Jerk Report,
The JERK Report is a weekly signal read for small business owners. One signal. Four layers. A five-minute practice. Every Monday. From Rose Thun at Design Rosetta