- Aug 4
JERK Report #25: I found the data
Three public numbers for demand, credit and labor.
The past few reports I have been trying to zoom in on the metrics that matter for a business.
Most businesses track revenue, profit, and return on investment. All useful. But all three move late.
Before revenue, ROI or profit comes demand, credit and labor.
An HVAC contractor, a two-person consultancy, or even a large defense contractor have almost nothing in common operationally. But they all sell something. Somebody finances the gap between doing the work and getting paid. Somebody does the work.
The three forces are the same. How you measure them is not.
In JERK Report #23 I told you to look at your own data for these three, because I could not find public data that worked. That is still the best thing to do first.
I kept digging. This week I have the public data, and what to do with it.
Reading any of the three
Position and velocity are interesting. The early warning is in the two layers underneath.
Acceleration tells you whether things are getting better or worse, and whether that is speeding up or slowing down.
Jerk tells you whether your answer to that is stronger or weaker than it was last time you looked.
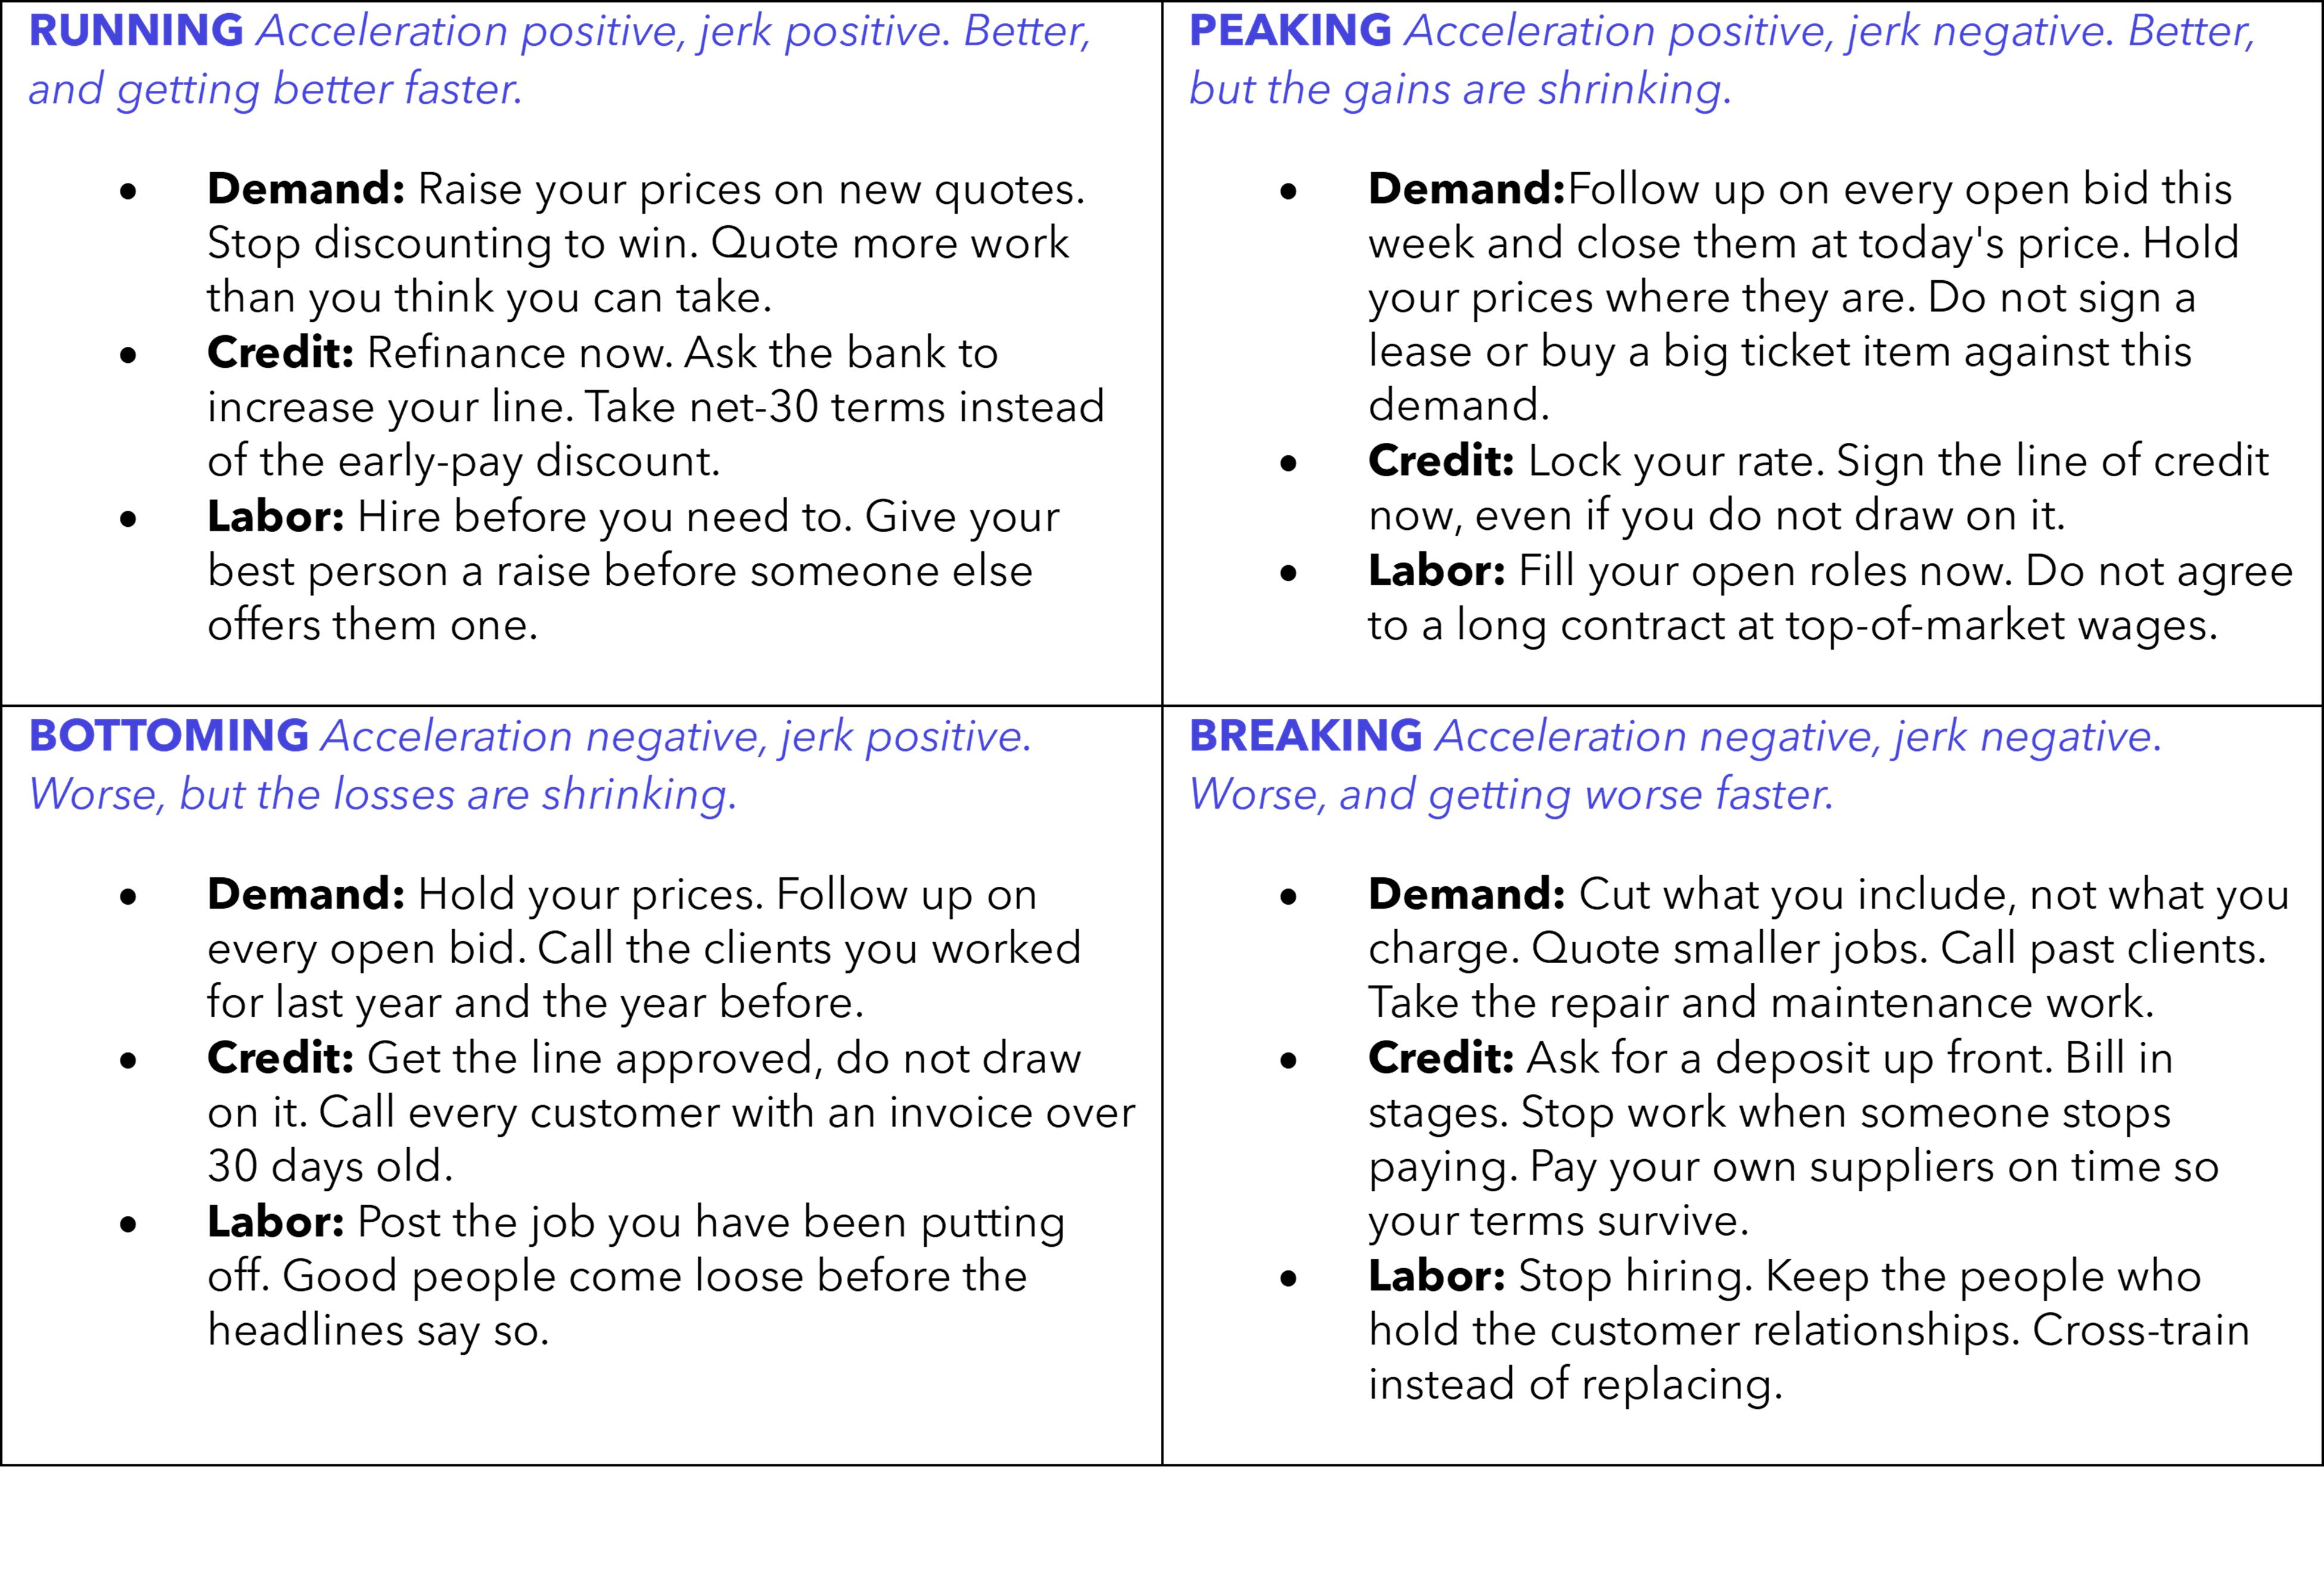
Put the two together and you get four situations.
Table 1.
Be careful about the sign
For every metric you use, write down which direction is good.
Rising backlog is good. Rising wage to fill is not.
This sounds obvious. It is the thing that gets read backwards when you are under pressure.
Use your own data where you have it
Your own numbers are closer to your business and easier to trace. JERK Report #23 covers those. https://www.designrosetta.com/blog/jerkreport-23
Outside numbers are worth having too, because as the adage goes “What gets measured gets managed.” Nobody knows who said it but it is valid. It can cut both ways. It helps improve business, until it doesn’t. A number your own team is measured on is a number your own team is likely to game and so external proxy metrics can also be useful.
The public proxies
These are a generic basket. They will not fit your business exactly. That is why I call them proxies. Use them when you do not have your own numbers, or to check the ones you do have.
I used rolling three-month averages on all three, because the month-to-month changes are small enough that the deeper layers are otherwise mostly noise.
Demand. Census M3, new orders, manufacturing excluding transportation.
Credit. St. Louis Fed Financial Stress Index. This measures stress, so when it goes down, conditions are getting better. I flipped the sign before running the numbers.
Labor. Indeed Hiring Lab Job Postings Index, Baltimore metro. Other metros and countries are in the same file.
For Maryland readers who are hiring, the state publishes regional wage values by role once a year. Useful for building an offer. Too infrequent for JERK.
What it says right now for Baltimore
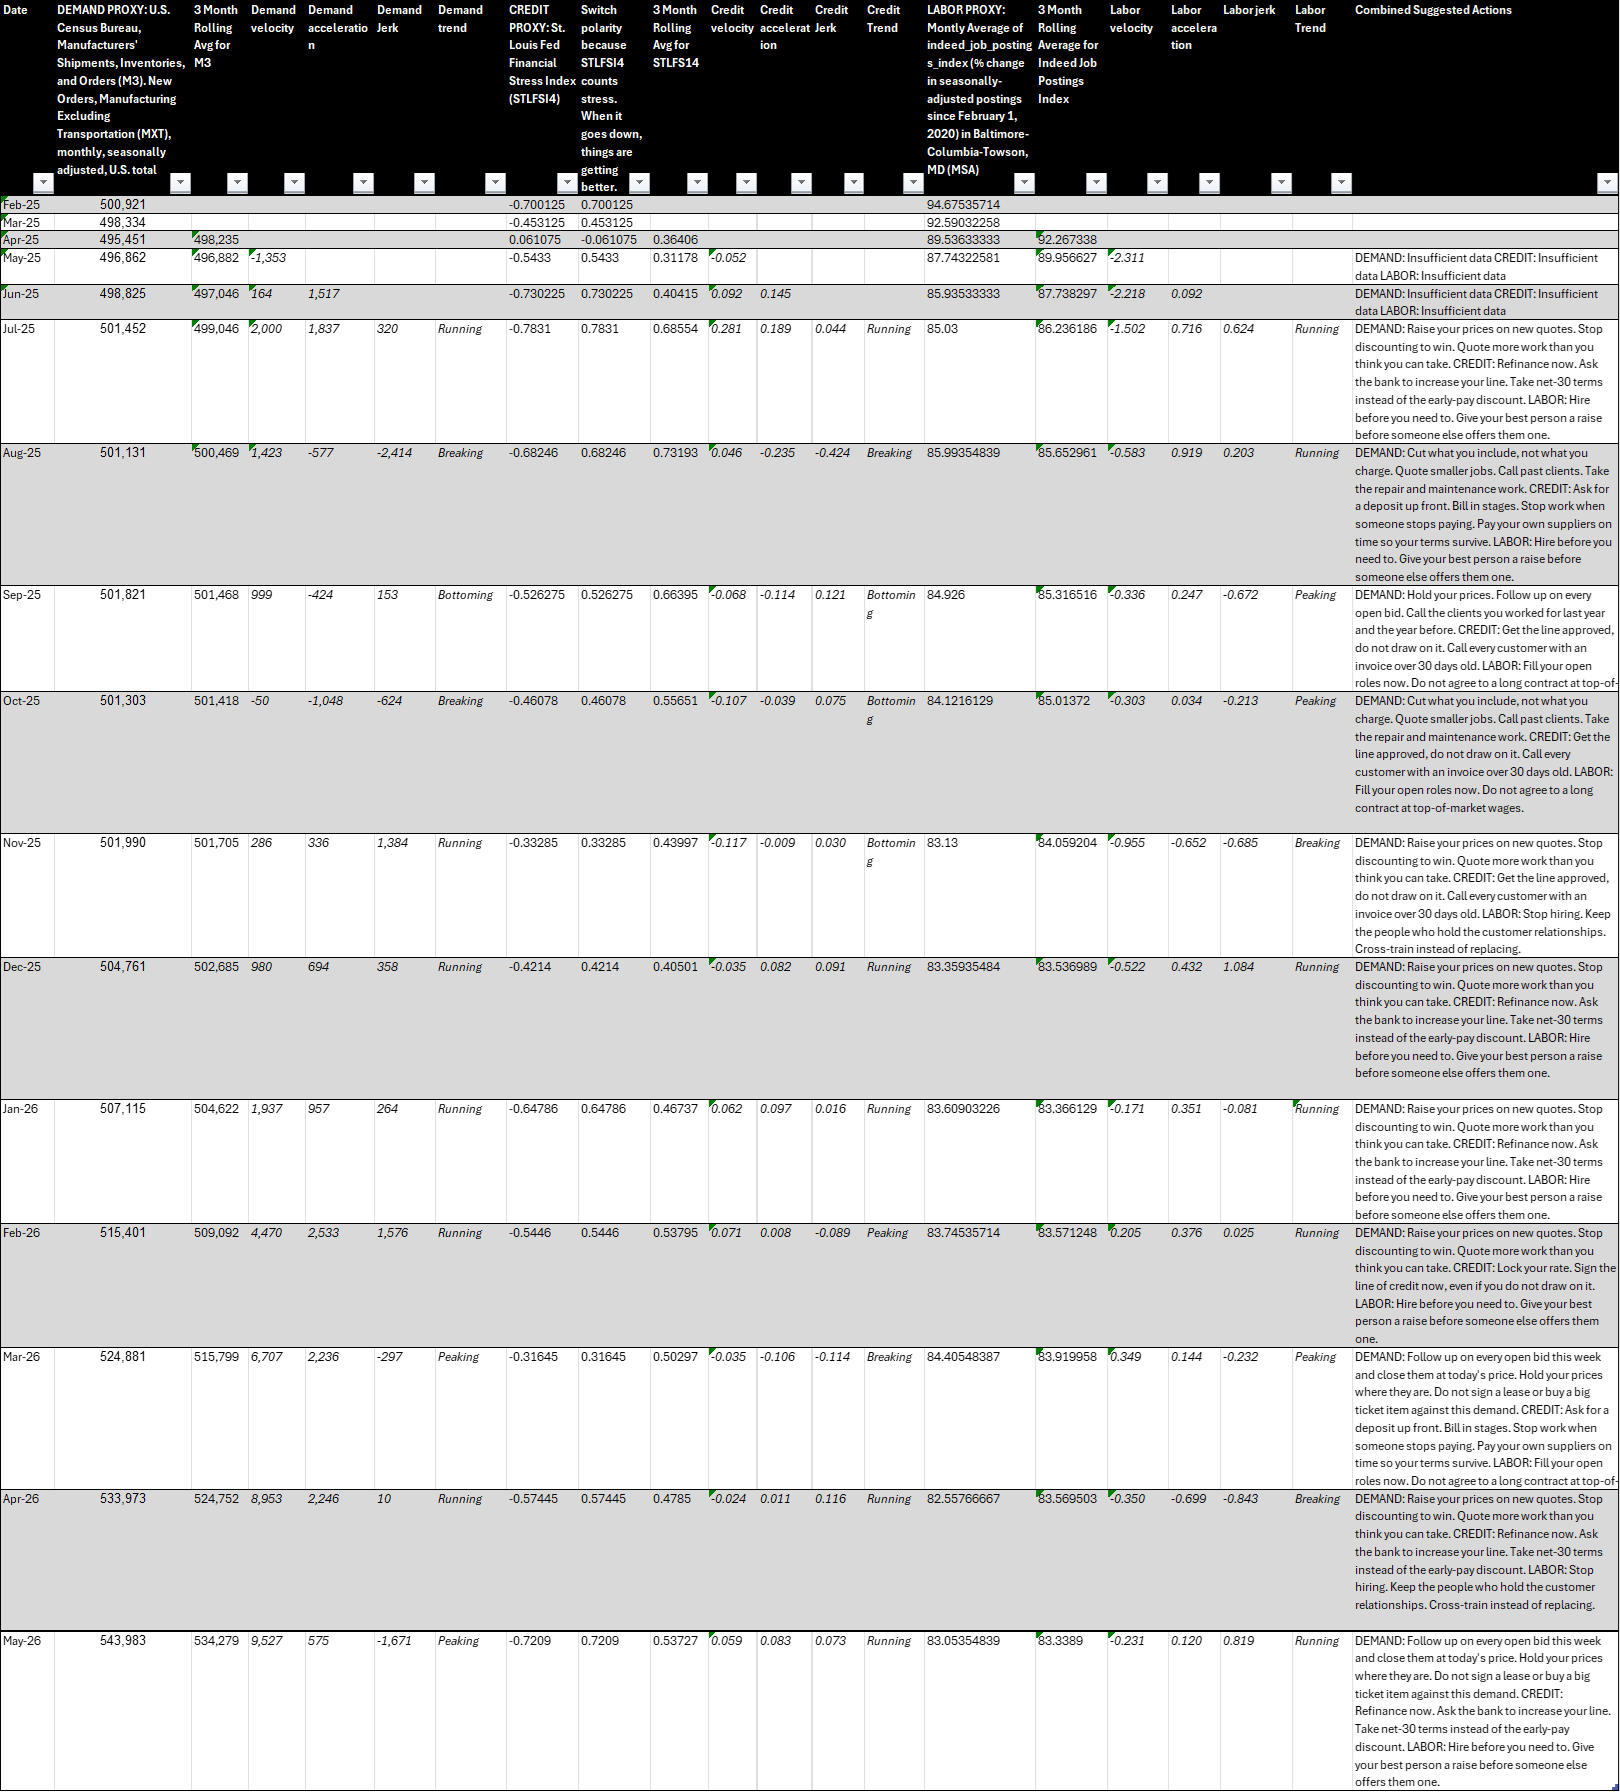
Details are in Table 2 at the bottom of the note. The highlights are:
· Demand. Peaking. New orders are up 9.5 percent on the year and still climbing. The speeding-up part has almost stopped, falling from 2,246 in March to 575 in May.
· Credit. Running. Financial stress has eased steadily since December.
· Labor. Running. Baltimore postings are down twelve percent over fifteen months. They are still falling. But the fall has been easing since spring, and that easing is picking up.
The Labor Running feels wrong, because the position is still going the other way. That is the point of the deeper layers. You are seeing a turn in direction before it arrives.
When the position number itself is still going the other way, do the cheap half. Write the job description. Get the offer approved. Do not raise anyone's pay yet on the strength of something that has not happened.
Your five-minute practice this week
Prompt your favorite LLM.
Given my business and the current external trends reading for the Baltimore area
Demand Peaking. Credit Running. Labor Running.
New orders up 9.5 percent on the year with the growth losing its driver. Financial stress easing steadily since December. Baltimore postings down twelve percent over fifteen months, with the decline flattening out since spring.
DEMAND: Follow up on every open bid this week and close them at today's price. Hold your prices where they are. Do not sign a lease or buy a big ticket item against this demand.
CREDIT: Refinance now. Ask the bank to increase your line. Take net-30 terms instead of the early-pay discount.
LABOR: Get ready to hire. Write the job description. Get the offer approved. Do not raise anyone's pay yet, because the hiring market has not turned yet, only the rate of its fall.
What is the 80/20 of the biggest implications (first, second, third order) you see for my business right now?
And then tell me "If you only do three things" the most important 3 things.
What this is building toward
This gets you started on watching acceleration and jerk in three places.
There is a lot I have not covered here. What makes a metric worth watching in the first place. Which of these matters most for the business you actually run. How often to read them.
That is a conversation, not an email, and it is what the workshops are for.
There are two new JERK workshops this month and next. The first covers the outside numbers, where to find them and how to read them. The second is about using your own numbers alongside them, and deciding who watches what. Both came out of the first workshop. They are new, so we will find surprises.
Dates and details are at https://www.designrosetta.com/training-and-services
Best wishes,
Rose
Details for Baltimore:
Table 2.
Sources
1. Demand: U.S. Census Bureau, Manufacturers' Shipments, Inventories, and Orders (M3). New Orders, Manufacturing Excluding Transportation (MXT), monthly, seasonally adjusted, U.S. total, January 2024 forward. Retrieved August 3, 2026. Transaction data. Read as a rolling three-month average. Current-month figures are preliminary and are superseded by revised estimates the following month. https://www.census.gov/manufacturing/m3/ Direct link to this query: https://www.census.gov/econ/currentdata/dbsearch?programCode=M3&startYear=2024&endYear=2026&categories[]=MXT&dataType=NO&geoLevel=US&adjusted=1¬Adjusted=0&errorData=0
2. Credit: Federal Reserve Bank of St. Louis, St. Louis Fed Financial Stress Index [STLFSI4], retrieved from FRED, Federal Reserve Bank of St. Louis, August 3, 2026. Weekly, ending Friday, not seasonally adjusted. Composite index of eighteen weekly series, where zero represents normal conditions. Values here are monthly averages of the weekly observations, sign-flipped so that higher readings mean easier conditions, then read as a rolling three-month average. https://fred.stlouisfed.org/series/STLFSI4
3. Labor: Indeed Hiring Lab, Job Postings Index, US metropolitan areas, Baltimore-Columbia-Towson MD. Daily, seasonally adjusted, indexed to February 1, 2020. Retrieved August 3, 2026. Licensed CC BY 4.0. Methodology revisions may restate historical values. Values here are monthly averages, read as a rolling three-month average. https://github.com/hiring-lab/job_postings_tracker Metro file: https://raw.githubusercontent.com/hiring-lab/job_postings_tracker/refs/heads/master/US/metro_job_postings_us.csv
4. For Maryland locals who may be hiring, the State collects regional values per role annually, Maryland Occupational Employment and Wage Statistics - Labor Market Information, which is useful for specific offers but not JERK data.
Check out the Jerk Report,
The JERK Report is a weekly signal read for small business owners. One signal. Four layers. A five-minute practice. Every Monday. From Rose Thun at Design Rosetta