- Apr 21
The JERK Report #10: Good news, for a change.
I'm told the JERK Reports have been a bit of a buzzkill.
True.
Jobs data. Tariffs. Agreements fraying. Severe weather repricing insurance. AI visibility upending websites. Revenue signals most people miss until it's too late.
The intent of this Jerk Report is always to give readers more agency by reading the earlier signals.
The framework doesn't require bad news. It just requires signals with measurable change. Positive acceleration is just as real as negative.
This issue is one of those.
A quick definition before we start
When I say "local" in this issue, I mean businesses whose primary customer base is geographically local — the dentist, the painter, the specialty food store, the neighborhood restaurant. Not every small business is local. A 40-person SaaS firm with customers across 30 countries is a small business but not a local one. This issue is about the local kind.
When the data says "independent stores," that generally excludes franchises — including locally-owned ones like a McDonald's or Dunkin'. The owner may live down the street, but the consumer dataset counts them as a chain.¹
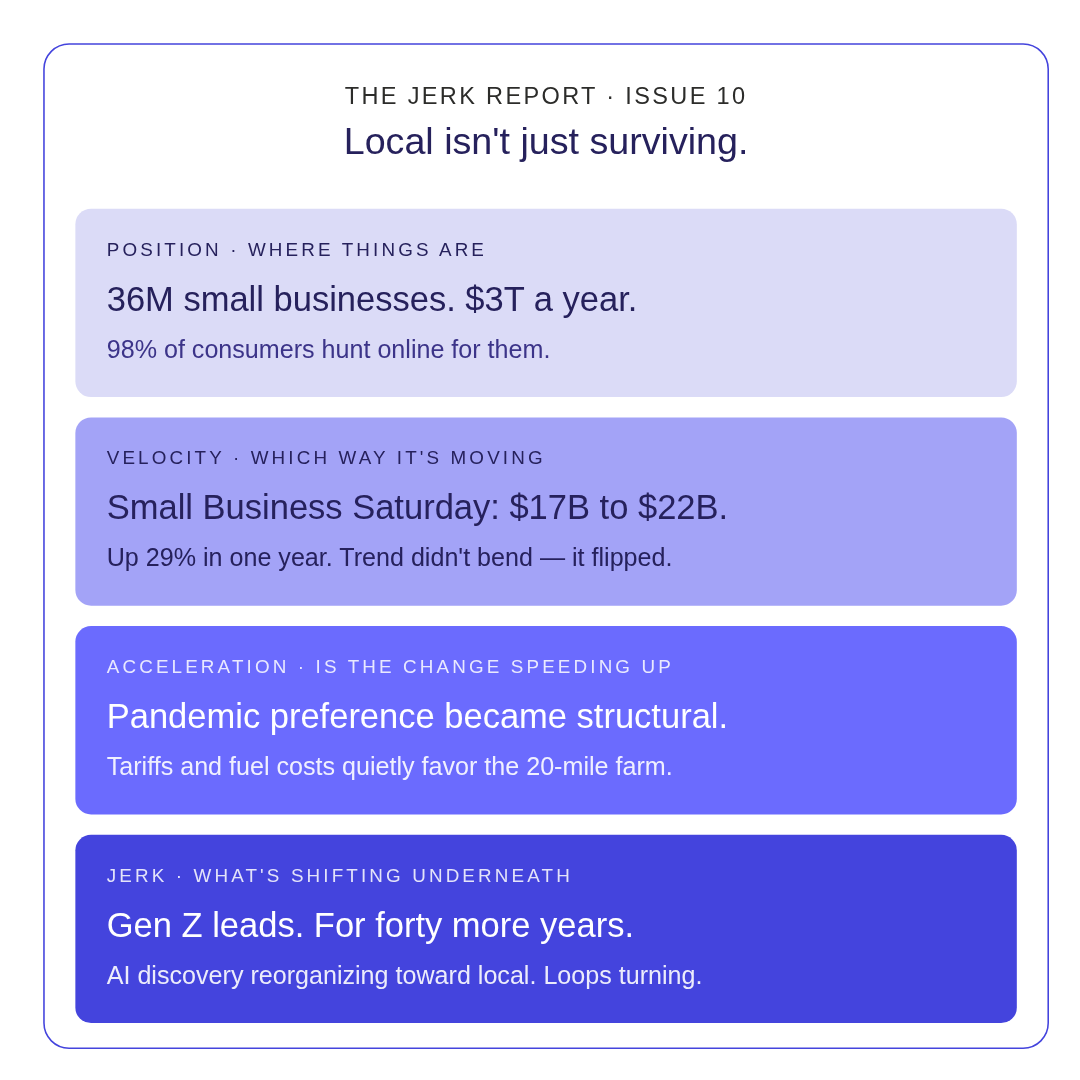
Position — where things stand right now
36.2 million small businesses in the United States. 99.9% of all US businesses. 43.5% of GDP. 45.9% of the private-sector workforce.²
That's the denominator.
Consumers are spending money at the independent ones, in volume. The average American adult spends roughly $11,740 per year shopping locally.³ Across roughly 260 million US adults, that's on the order of $3 trillion per year — about 15% of total US personal consumption expenditures.⁴
And they're hunting. 98% of consumers use the internet to find information about local businesses, up from 85% in 2019.⁵
That's not curiosity. That's intent.
Velocity — which direction is it moving?
Up. Sharply.
Small Business Saturday spending across three years:
2022 → 2023: $17.9B → $17B. A slight decline.⁶ A weak holiday season overall, not a local-specific dip.
2023 → 2024: $17B → $22B. Up 29%.⁷
Velocity didn't just go positive. It flipped — from slight decline to strong growth in one year. A 34-point swing in the rate of change.
Consumers also plan to increase spending at independent restaurants by nearly 12% in 2026.⁸
Holiday spending at small businesses is projected at $109 billion this year — up 44% over 2024.⁹
A note on methodology: the 44% figure measures the full holiday season across all small business spending. The 29% figure measures Small Business Saturday specifically. Different denominators, same direction.
Acceleration — is the trend speeding up or slowing down?
Speeding up.
Local search isn't a niche channel anymore. It's the default way consumers find businesses. The share of consumers reading local reviews has climbed every year, with no sign of plateau.¹⁰
McKinsey's 2025 research confirms it: what started as a pandemic-era behavior has become a structural preference. "Support your neighbors during lockdown" became "I prefer shopping this way."¹¹
71% of small business owners report their financial performance improved in 2025 over 2024. 92% describe their current condition as stable or growing.¹²
Cost structures are shifting, too. Tariffs on imported goods and elevated fuel prices are quietly repricing national supply chains relative to local ones. When it costs more to ship a tomato from 2,000 miles away, the farm 20 miles away gets a relative price advantage.¹³
Consumer preference strengthening. Small business health improving. Cost structures favoring shorter supply chains.
The curves are reinforcing each other.
Jerk — what's shifting underneath the acceleration?
Three things say the acceleration is still gaining momentum.
First: the youngest cohorts are leading this.
Average purchases at independent stores per year, by generation:¹⁴
Gen Z (18–28): 155
Millennials (29–44): 158
Gen X (45–60): approximately 128
Boomers (61–79): 48
Silent (80+): 48
That's not nostalgia. It's preference.
A 68-year-old Boomer will make fewer purchases next year. A 28-year-old Gen Z will make more — for the next forty years.
52% of Gen Z say they plan to spend more at small businesses this year, compared to 19% of Boomers.¹⁵
When the youngest cohorts lead a behavior shift, acceleration doesn't plateau. It builds.
Second: AI is reorganizing discovery around local.
AI-driven traffic to e-commerce sites grew rapidly in 2025 — more than 10x in some reports, though from a small base.¹⁶ Google's AI Overviews increasingly appear on local queries, pulling the local answer forward in ways traditional search didn't.
The infrastructure of discovery is reorganizing. Local is where it's reorganizing toward.
Third: the reinforcing loops are building.
65% of small businesses plan to expand their online sales channels — investing in local SEO, Google Business Profiles, direct-to-consumer tools.¹⁷
More visibility → more searches → more local spending → more investment in being found.
That loop is turning.
And the reason underneath all of it: consumers aren't hiring "local" to save money. For every dollar spent at a small business, 68 cents stays in the community¹⁸ — that matters, but it's not the lead reason anymore.
Increasingly, they're hiring local for the thing Amazon can't deliver: the conversation. The recommendation from someone who knows them. The relationship.
That's the job to be done. And no amount of algorithmic optimization solves for it.
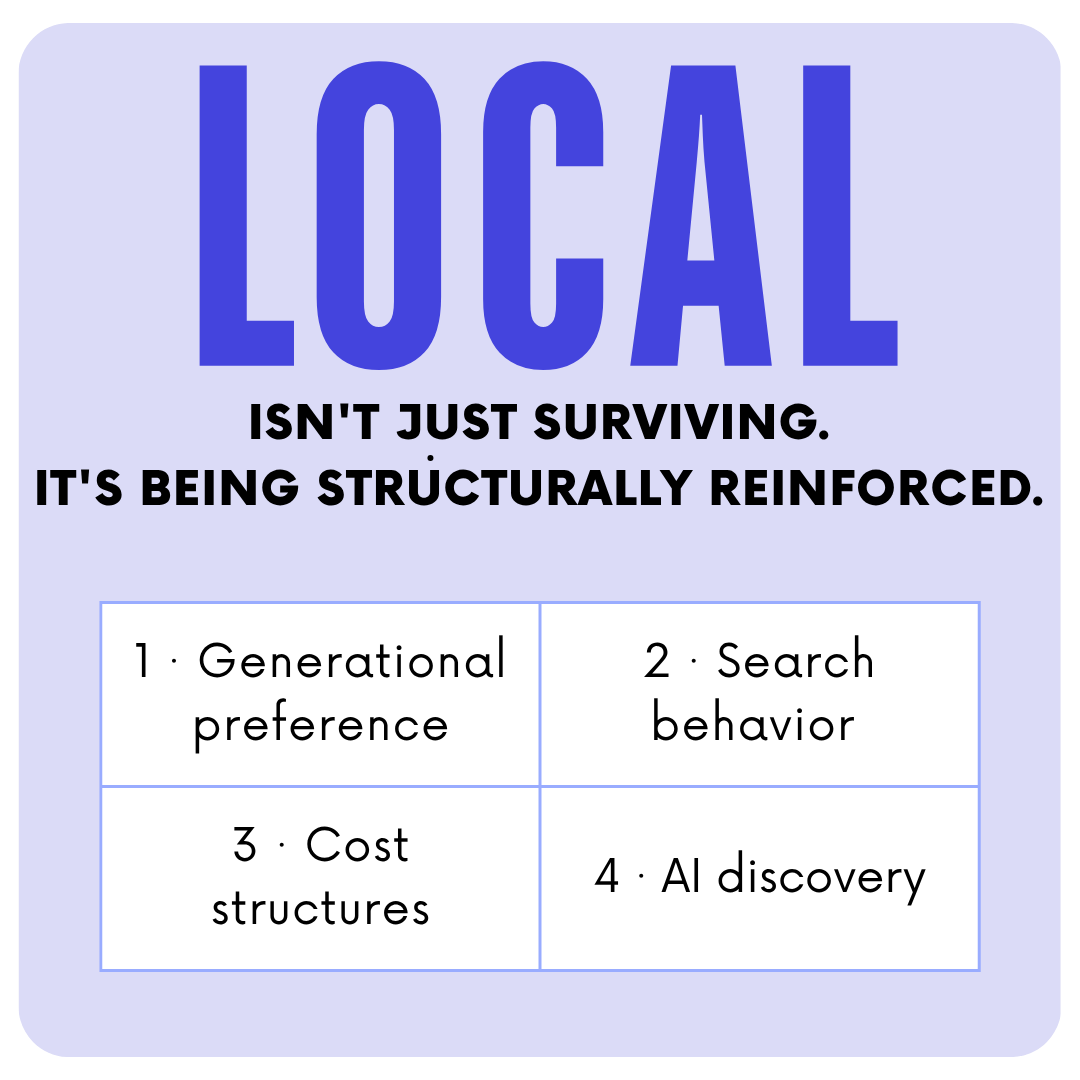
Local isn't just surviving. It's being structurally reinforced by generational preference, search behavior, cost structures, and AI discovery patterns.
What this means for your business
Most signals in this report are warnings.
This one is an invitation.
The trend is in your favor. The searches are happening. The discovery infrastructure is reorganizing toward you. A generation that will be spending for forty more years is leading the shift.
Your job is to be findable when they arrive.
That means a complete Google Business Profile. A website that answers questions in the first 60 words, not just describes your brand. Reviews that get responded to. Content that's current.
If this sounds like the AEO work from Issue #6, it is. These signals reinforce each other. The five-minute practice below tells you whether you're positioned to catch the wave.
Your five-minute practice this week
Open your LLM of choice. Paste this in, filling in the bracketed parts:
I own a [type of business] in [city, state]. My ideal customer is searching for [the two or three things I actually sell, in everyday language — not industry jargon].
Act as that customer. Write the five search queries they would most likely type or speak to find a business like mine. Use natural language. Include at least one "near me" phrasing and one question-based phrasing ("what's the best…", "who does…").
Then, for each query, tell me:
What kind of result would satisfy that search — a map pack, a list of businesses, a direct answer, a how-to, or a comparison.
What would make a business stand out in that result — reviews, photos, hours, a specific specialty, a price, a neighborhood name.
What is the one piece of information a business in my category most often leaves out that the customer wishes they had.
Be specific. Use my city, not generic language.
That's the five-minute version.
If you want the afternoon version, I'm running a live AEO workshop on Thursday, May 21, 2026. You'll leave with a read on where you stand, a one-page priority punch list, and the specific website changes to make first.
The JERK Report is a weekly signal read for small business owners. One signal. Four layers. A five-minute practice. Every Monday.
Sources
OnDeck's 2025 survey language distinguishes "independent stores" from "chain stores." OnDeck — What Consumers Think About Shopping Local.
Office of Advocacy, U.S. Small Business Administration, Frequently Asked Questions About Small Business 2026 (February 2026). advocacy.sba.gov
OnDeck survey of 2,000 US adults, conducted by Censuswide, December 11–18, 2025. ondeck.com
Derived figure. $11,740 per US adult × ~260M US adults ≈ $3.05 trillion annually. Compared against US Bureau of Economic Analysis annualized personal consumption expenditures of roughly $20.4 trillion (February 2026). Order-of-magnitude estimate, not a published statistic. bea.gov
BrightLocal, Local Consumer Review Survey 2025 — 98% of consumers use the internet to find information about local businesses (up from 85% in 2019). brightlocal.com
American Express 2022 Small Business Saturday Consumer Insights Survey ($17.9B reported for 2022 event) and 2023 survey ($17B reported for 2023 event). americanexpress.com/shopsmall
American Express Small Business Saturday Consumer Insights Survey, 2024 event reported at $22 billion. americanexpress.com/shopsmall
OnDeck December 2025 survey, per footnote 3.
Intuit QuickBooks 2025 Holiday Shopping Report.
BrightLocal, Local Consumer Review Survey annual series. brightlocal.com
McKinsey & Company, State of the Consumer 2025.
SBE Council Small Business Check Up Survey, February 10–13, 2026 (539 small business employers, conducted by TechnoMetrica). sbecouncil.org
Context from USDA Economic Research Service food-price data and multiple 2026 trade-policy briefings. ers.usda.gov
OnDeck/Censuswide December 2025 survey. Gen X figure approximated from the published overall mean (128/year).
OnDeck/Censuswide, per footnote 3.
Adobe Analytics 2025 Holiday Shopping Report. Growth figure is significant but from a small base.
OnDeck Q4 2025 Small Business Cash Flow Trend Report aggregated with SBE Council February 2026 surveys. ondeck.com/small-business-trends
American Express 2025 Small Business Economic Impact Study. americanexpress.com/shopsmall
Check out the Jerk Report,
The JERK Report is a weekly signal read for small business owners. One signal. Four layers. A five-minute practice. Every Monday. From Rose Thun at Design Rosetta